Manufacturing

& food.

AI in manufacturing and food production.

The plant has been generating data for years: line stoppages, energy use, batches, waste. It is almost never matched against what it costs.

It is the industry where the data is already there and the project is about putting it to work, not going out to find it.

Manufacturing & food

What AI changes in manufacturing

In manufacturing the starting point is comfortable and misleading at the same time: there is a huge amount of data. Instrumented machines, production reports, batch and waste records. What is almost always missing is the translation into money.

A plant knows how many times a line stopped last month, and yet it does not know what each of those stoppages cost. It knows how much waste it had, but not which product is eating the margin. It has the full breakdown history in the maintenance system, and it still services machines by the calendar rather than by their actual condition.

The result is that the decisions that move the most money rest on the experience of whoever has spent twenty years on the plant floor. When to stop for maintenance, which product to stop making, which supplier is costing more than it seems. That experience is valuable and cannot be replaced. What matters is backing that experience with up-to-date information.

5systems that coexist in a plant: ERP, maintenance, PLCs, quality and warehouse
0new sensors needed for the first project, almost always
3-6 ha week currently spent rebuilding the traceability of a single batch


Where it gets stuck today

What we hear in food plants, processing plants and industrial manufacturing, whether they run one line or six.

Maintenance runs by the calendar

The service is due because three months have passed, not because the machine needs it. So you stop what was running well and break what was running badly. And the breakdown history, which would tell you which is which, is complete in the system and never used to decide.

Line stoppages have no price

They are counted, with time and cause. What is missing is what each one cost: product not made, shift hours, material lost at start-up. Without that link, deciding what to fix first is an argument about opinions.

Batch traceability is rebuilt by hand

When a customer or an audit asks about a batch, someone goes through the ERP, the plant reports and the odd notebook. It can be done, but it takes hours and has to be repeated every time.

Waste is measured, but not by product

The monthly total is known; which specific product the margin is leaking from is not. The standard cost sheet says one thing and the plant does another, and the gap shows up nowhere until month-end.

Three things you can automate now

All three rely on data the plant is already recording today, without installing a single new sensor.

Maintain

When do I really need to stop this machine?

A model built on the breakdown history, the running hours and the signals already being recorded. It ranks interventions by real risk rather than by date, and the calendar stops being in charge.

Cost

What does each stoppage and each loss cost me?

Matching plant reports against product, shift and material cost, so that every stoppage and every unit of waste has a price next to it. It is the project that turns production meetings into decisions.

Trace

Where has this batch been?

Pulling together the batch trail that today is split between the ERP, the plant and paper, and making it searchable on the spot. It stops being a manual reconstruction every time someone asks.

What the first project would look like

Four steps, and the work is not in collecting the data. It is in agreeing what an hour of stopped line is worth.

  1. 1

    Choose one line and one month

    Not ‘a plant dashboard’, but the stoppages on one line during a month that has already closed. A scope that production recognises on sight, because they lived through it.

  2. 2

    See where each number comes from

    Whether the stoppage is logged by the machine or noted by the operator at the end of the shift, and whether the reason comes from a fixed list or a free-text field. That decides whether the data can be grouped.

  3. 3

    Agree the cost of an hour of downtime

    That number is not measured: it is decided, and production and finance decide it together. Without that prior agreement, each department reads the same report with a different figure.

  4. 4

    And then, predict

    With the history of stoppages and breakdowns already costed, condition-based maintenance and demand forecasting have something to feed on. Without the cost next to it, a model can be right and still change no decision.

Where to start in manufacturing

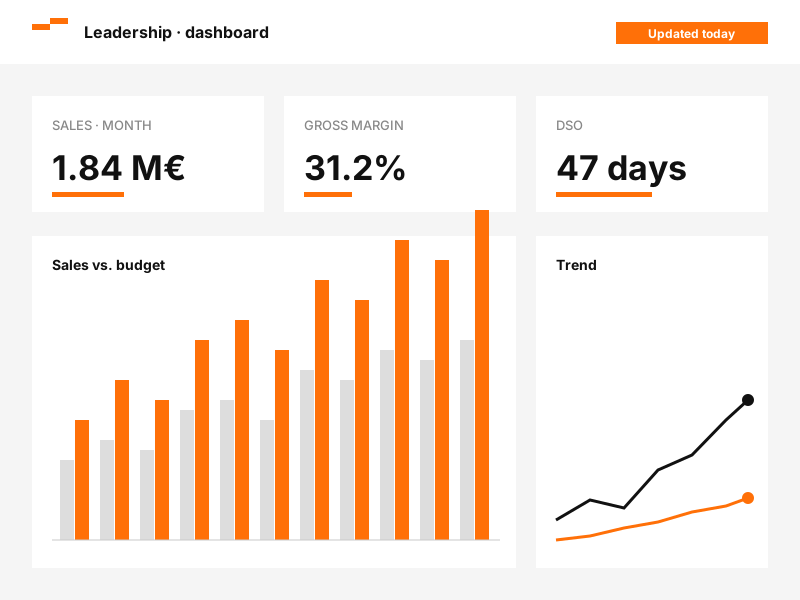
Here the dashboard comes first, the opposite of construction. The data is already recorded; all it lacks is a price next to it.

First: put a price on what is already measured

Stoppages, waste and energy use matched against product, shift and material cost. It is the fastest project in this industry, because there is no data to go looking for.

Business Intelligence

Next: predict the breakdown and the demand

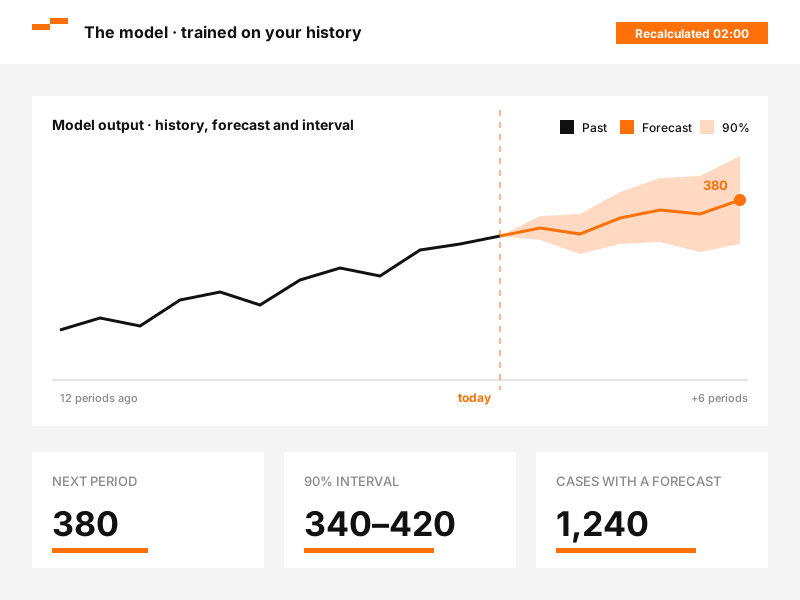
With the breakdown and production history you can rank maintenance by real risk and anticipate demand product by product.

Machine Learning

Then: join up plant, ERP and warehouse

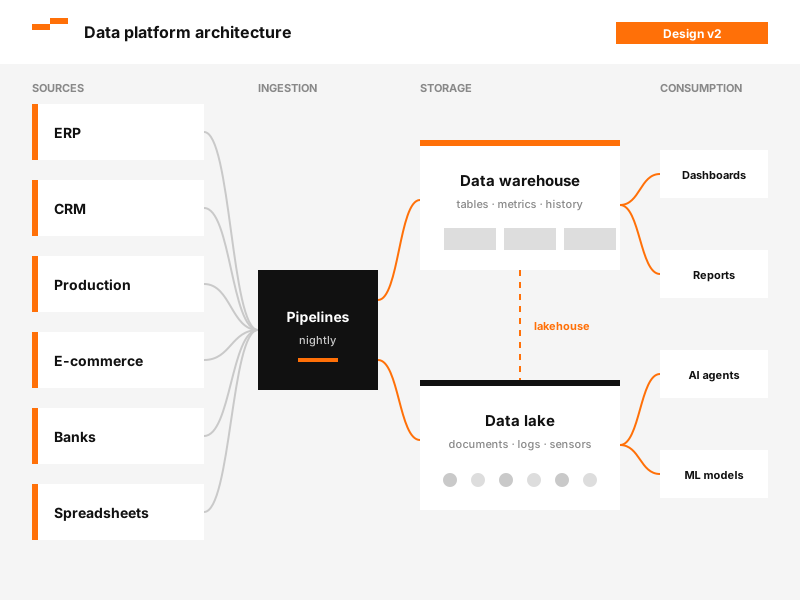
Batch traceability on demand needs the three systems to talk to each other. That is when the data platform stops being a technical layer and starts answering a specific question.

Data platforms

Finally: the full restocking and close cycle

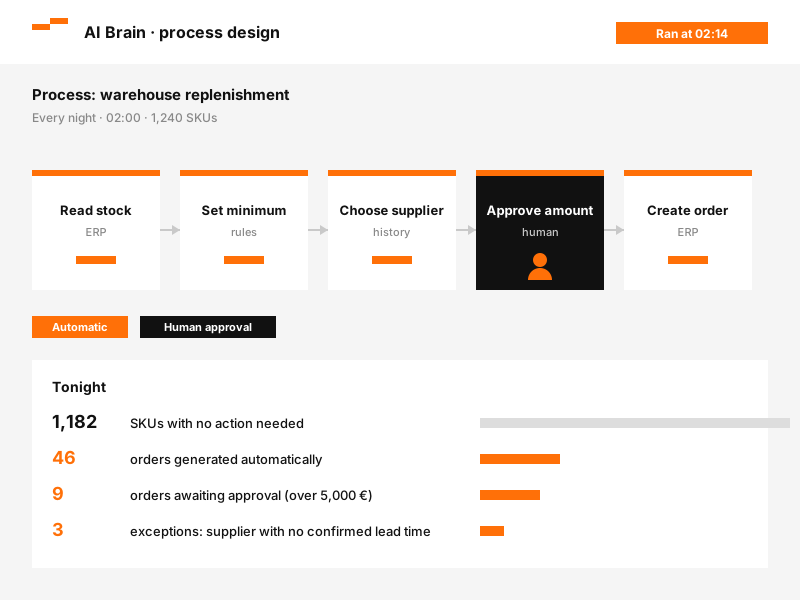
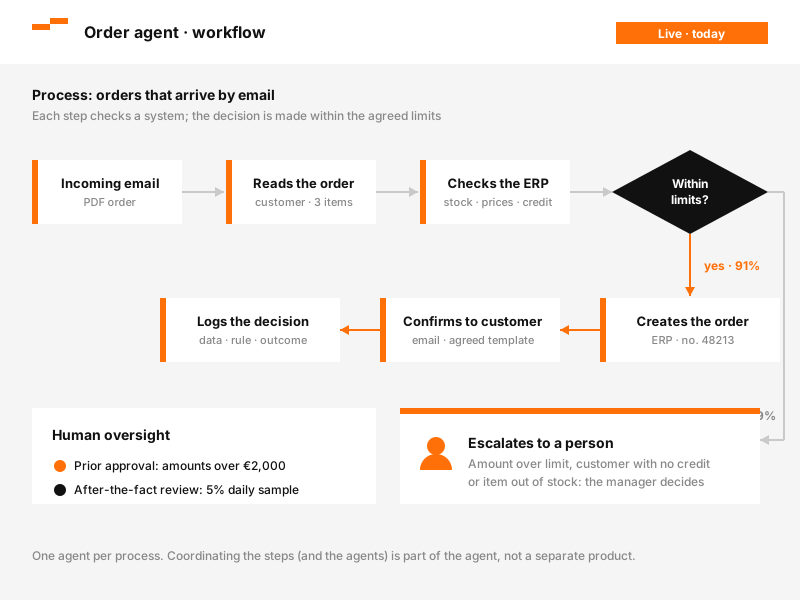
Restocking raw materials, placing the supplier order and preparing the production close, with the business rules agreed and a person authorising the exceptions.

AI workflow automation

What we build in a plant

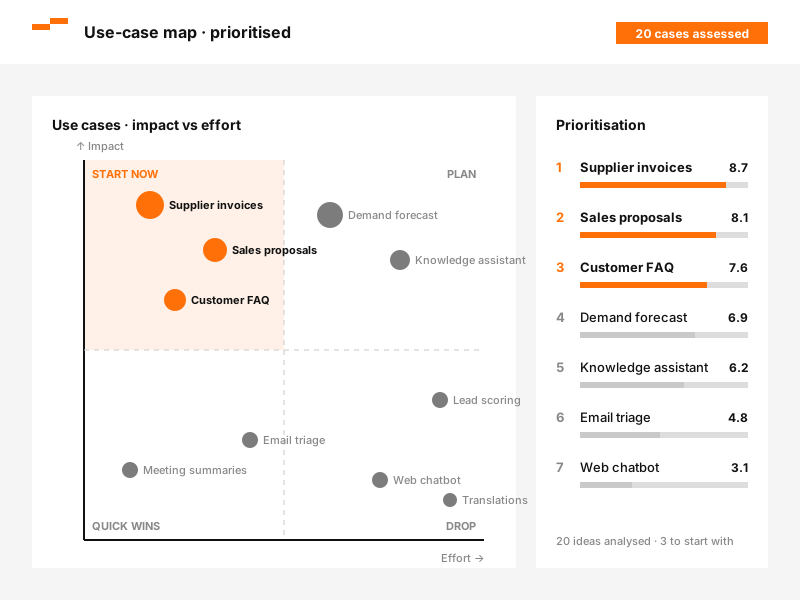
All seven, in the order they usually come into a plant. Here the first four are the quick ones, because the data is already recorded and nobody has to go looking for it.

Frequently asked questions

Let's talk about your project
Do we need to install sensors or replace machines?

Almost never to start with. Most plants already record far more than they use: production reports, the maintenance system, the ERP and often the line's own PLC. The first project is done with that. If something specific needs instrumenting later, it is decided with the number in front of you, not before.

We are a food company, not a parts manufacturer. Does anything change?

Two things change, and both matter: shelf life and traceability. In food, the batch is not just a quality record; it is a legal obligation. And waste has a shelf-life component that other industries do not have. The projects take the same form, but AI in food manufacturing has to carry the product's shelf life inside the calculation.

Our maintenance system is a spreadsheet. Will that do?

It will if it has dates and causes. To rank maintenance by risk you need the history of what broke, when and on which machine. The format matters less than you would think. A history where the cause was only recorded some of the time will not do.

Isn't this what they call Industry 4.0?

It overlaps, but the name usually comes with a much bigger project: instrument the whole plant, connect everything and build the platform before seeing any result. We prefer the opposite order, and in this industry it is possible. One specific process, measured in money, using what is already recorded.

Who from the company needs to be on the project?

Someone from the plant and someone from finance or management accounting, and the second is usually the one missing. The project is about bringing physical data together with cost data, and those two live in departments that rarely meet.

How long before we see the first number?

It depends on the state of the data, not the industry, and in manufacturing the data is usually in good shape. What we do agree before starting is which number has to move: the cost of a stoppage, waste by product, margin by product. Without that agreement, the end of the project becomes an argument about opinions.

We have several plants and each one records things its own way. Where do we start?

With one, and with the one that records best, not the one in the worst shape. The temptation is to fix the struggling plant first; the problem is that there the project turns into an instrumentation job and takes three times as long to show a number. With one plant working and the calculation already agreed, extending it to the others is a matter of connection and shared vocabulary, not of starting from scratch.