

How is it different from the reports I already have?
Nobody has to build them. The data loads itself, each metric is defined once and the dashboard is up to date whenever you open it.

Business
Intelligence
Business Intelligence
Turning the data your company already produces into a single version of the truth, visible every morning with no spreadsheets in between.
A Business Intelligence system collects the data from your ERP, invoicing, production and sales software, then cleans it and joins it up in a central data warehouse. From there it feeds dashboards that answer specific questions: how much we sold, at what margin, where the budget is drifting.
What sets it apart from a hand-built report is not the chart, it is the reliability. Every figure has an agreed definition, a traceable source and a refresh date. When management and finance look at the same number, it is because it really is the same number.
The first three, answered in two lines each.
Nobody has to build them. The data loads itself, each metric is defined once and the dashboard is up to date whenever you open it.
Yes, if you already have an ERP and someone spends hours every week putting reports together. From there, the system pays for itself in that time.
The first useful dashboard takes 4 to 8 weeks. We start with the question that hurts most, not by integrating everything at once.
Six separate pieces that can be commissioned together or on their own, depending on what your company really needs.
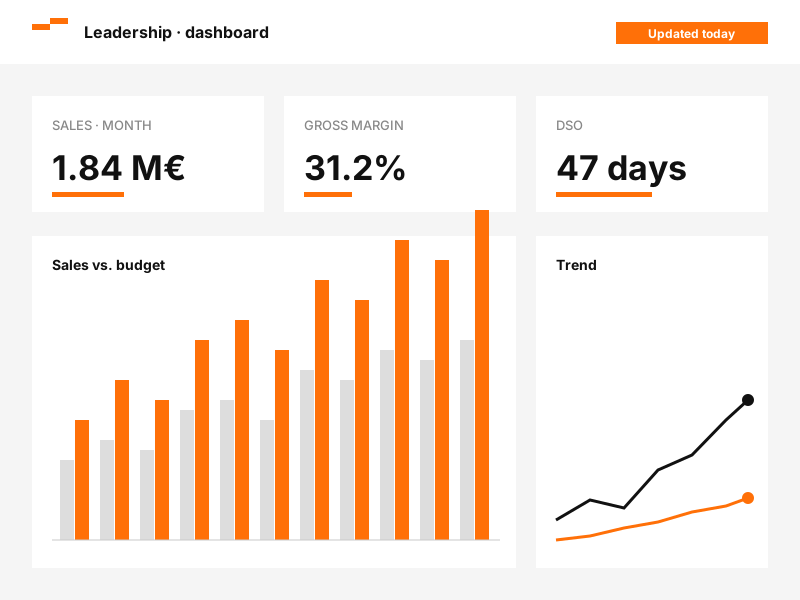
Management, finance and operations do not need the same view. Each opens their own and sees their five numbers in under a minute, with the detail there if they need to drill down.
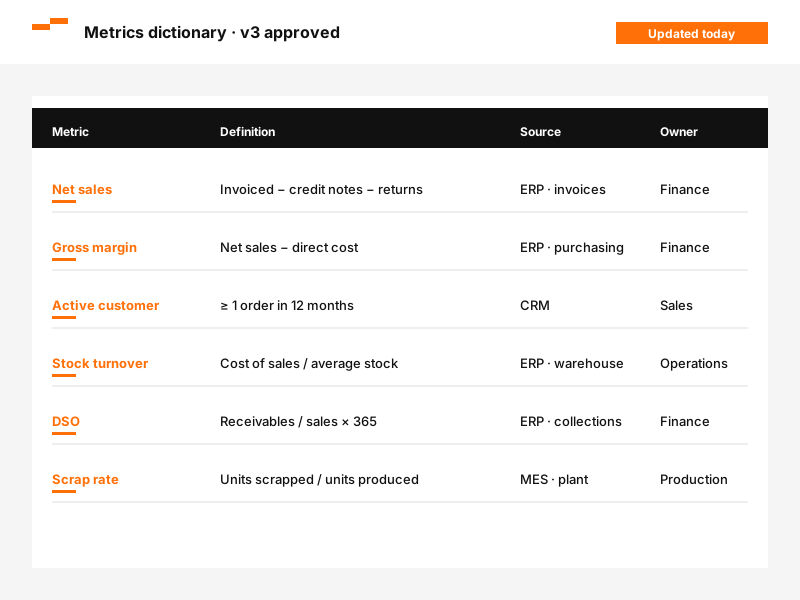
What 'margin' means, when a sale counts, what is left out. One definition per metric, signed off with the business, and the same calculation in every dashboard.
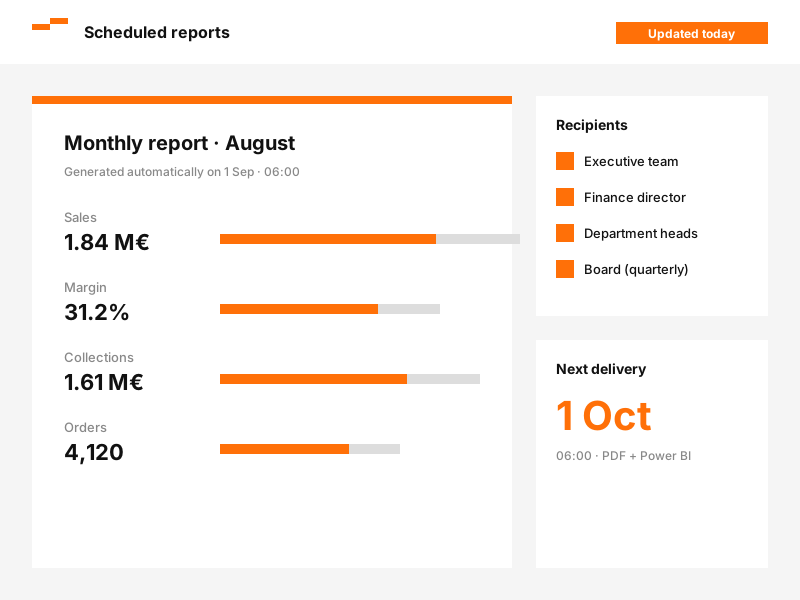
The monthly report, the weekly sales report, the production report. They are generated and distributed without anyone touching them. This is usually the part that pays for the project first.
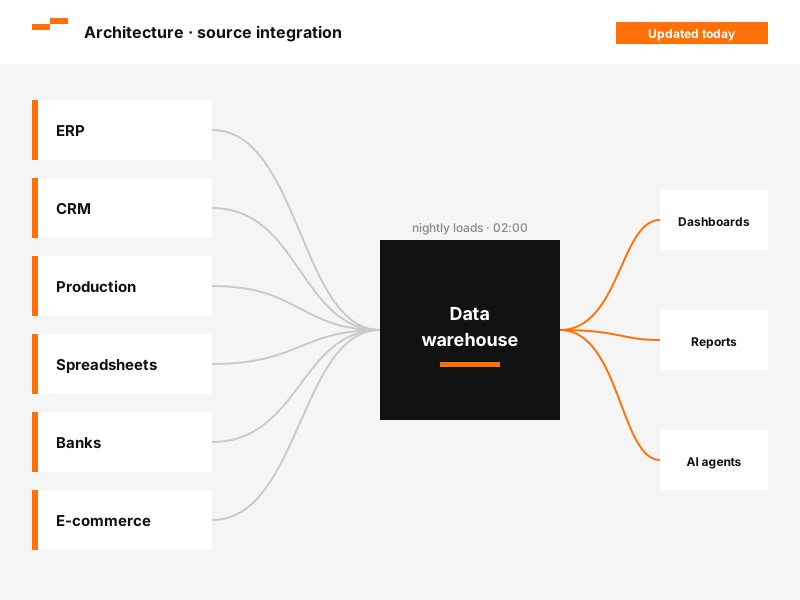
ERP, CRM, production, spreadsheets and bank feeds, loaded every night into a data warehouse that is the only source for every dashboard.
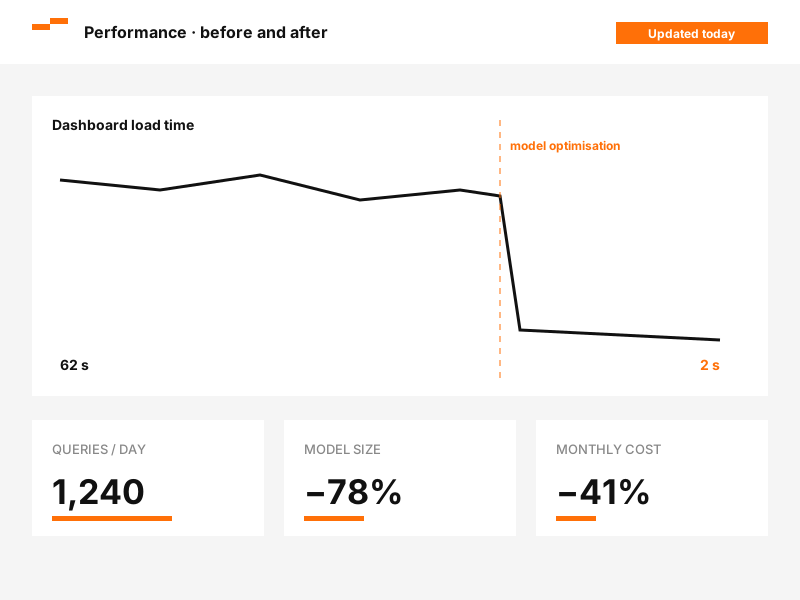
When the problem is a dashboard that takes a minute to open, the work lies in the data model and performance. It is usually fixed in a matter of weeks, without rebuilding everything.
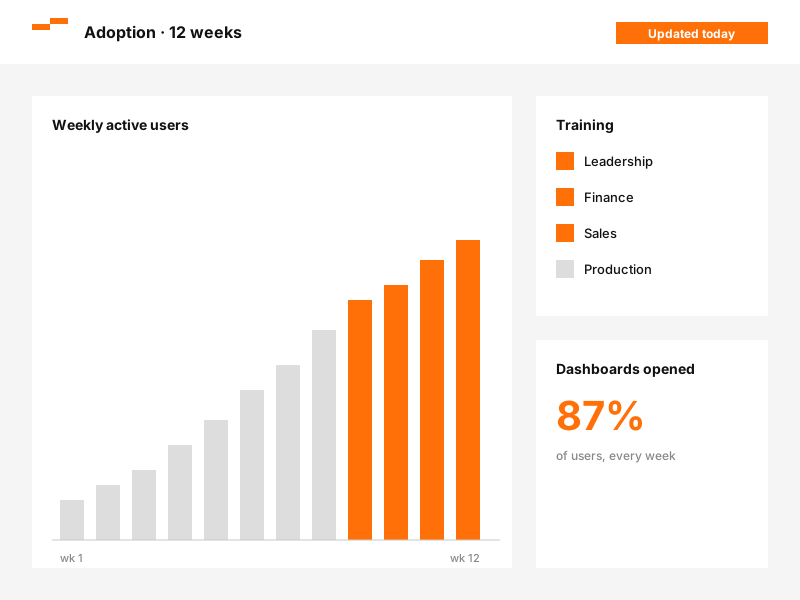
A dashboard nobody opens does not exist. We train each team on its own dashboard and track usage until it becomes part of the routine.
Five steps, and the first one is not technical.
'I want to know which products are losing me money' works. 'I want a dashboard' does not say which decision it is going to change.
Sources, quality and access. This is where the timeline and the budget come from, not from a project template.
Within weeks, with a tight scope and real data, so the team can use it and tell us what is missing.
Nobody learns a dashboard from a presentation: they learn it by using it. We adjust it with the team in the room.
Documented, and with your team able to maintain it. If you would rather we maintained it, we agree that; we do not work to make you dependent on us.
BI calculates, AI decides. Business Intelligence gives you the validated figure and displays it. An AI system reasons over that information, runs processes and makes decisions within the limits you set.
One does not replace the other, and the order is not negotiable. An automation that rests on a metric nobody has agreed on inherits the argument instead of settling it.
In practice, many projects start with BI and carry on into AI workflow automation. The dashboard shows that an order ought to be placed; the next step is for the order to place itself.
Your systems
Business Intelligence
AI acts

Margin by product, customer and channel, with overheads allocated properly. This is where a product being sold at a loss, without anyone knowing, turns up most often.

Profit and loss and budget variances without waiting for the manual month-end close. The finance team stops working two weeks behind.

Stock-outs, overstock and real turnover by item, with alerts before the problem reaches the customer.

Customer concentration, falling orders spotted in time, and performance by sales rep and by territory.

Plant performance, waste and downtime, set against what they cost. This is where operations data becomes a financial decision.
The ones that come up before a project is approved. If yours is missing, write to us.
Let's talk about your projectIt depends almost entirely on the state of your data, not on the number of reports. What drives the work is how many sources need integrating and what shape they are in. We fix the price after a one-hour session looking at your systems.
If your company already works with Microsoft 365, Power BI is usually the sensible choice on cost and integration. Tableau has the edge when the main use is visual exploration. Your environment makes the decision, not our preference.
No. We build it as part of the project, sized to what you need today. A BI project without a warehouse ends up with dashboards querying the ERP directly, and that breaks as soon as volumes grow or the software changes.
Yes, and the return often comes sooner than in a large one, because there are not ten departments to bring into line on a single definition.
The system is yours: the code, the model and the documentation are handed over. If you like, we carry on with monthly maintenance covering incidents, changes to the sources and new dashboards. But the option of depending on nobody has to be on the table.
Everything. An AI agent that answers 'how is the margin looking this month?' needs the same things as a dashboard: clean data, defined metrics and a warehouse to query. BI is the foundation that lets AI say something true.
Manufacturing and food, because the plant already records stoppages, consumption and waste, and all that is missing is the cost alongside them. And yachting and marine, where calculating minimum and ideal stock levels (case study in Spanish) cut stock-outs by 85%. In healthcare it comes second, on financial data.